Thursday, June 30, 2011

Tumor Lysis Syndrome

Tumor lysis syndrome refers to a metabolic derangement due to high tumor burden and rapid cell turnover, resulting in release of intracellular contents. Patients may present with acute renal failure and metabolic derangements, including:
  • Hyperuricemia from purine metabolism
  • Hyperkalemia
  • Hyperphosphatemia
  • Hypocalcemia caused by hyperphosphatemia and the resultant precipitation of calcium phosphate.
While tumor lysis syndrome is most commonly a complication of treatment of blood-borne malignancies such as acute lymphocytic leukemia and poorly differentiated lymphomas (e.g., Burkitt), cases of tumor lysis syndrome related to treatment of solid organ tumors have also been reported. Treatment modalities that can lead to tumor lysis syndrome include chemotherapy, radiation therapy, immunotherapy, interferon therapy, hormonal therapy, surgery, chemoembolization, and radiofrequency ablation. Cases of spontaneous tumor lysis syndrome have also been reported.

The Cairo-Bishop definition includes two classes of tumor lysis syndrome:
Laboratory tumor lysis syndrome: Any 2 of the following:
  • Uric acid > 8 mg/dL or 25% increase
  • Potassium > 6 mEq/L or 25% increase
  • Phosphate > 4.5 mg/dL or 25% increase
  • Calcium < 7 mg/dL or 25% decrease
Clinical tumor lysis syndrome: Laboratory tumor lysis syndrome plus one or more of the following:
  • Creatinine > 1.5x upper limit of normal
  • Seizure
  • Cardiac arrhythmia
  • Sudden death
Management focuses on prevention in high-risk patients with allopurinol and hydration. Treatment after renal failure has occurred involves hydration and loop diuretics to maintain urine flow, recombinant uricase (catalyzes insoluble uric acid), and hemodialysis.

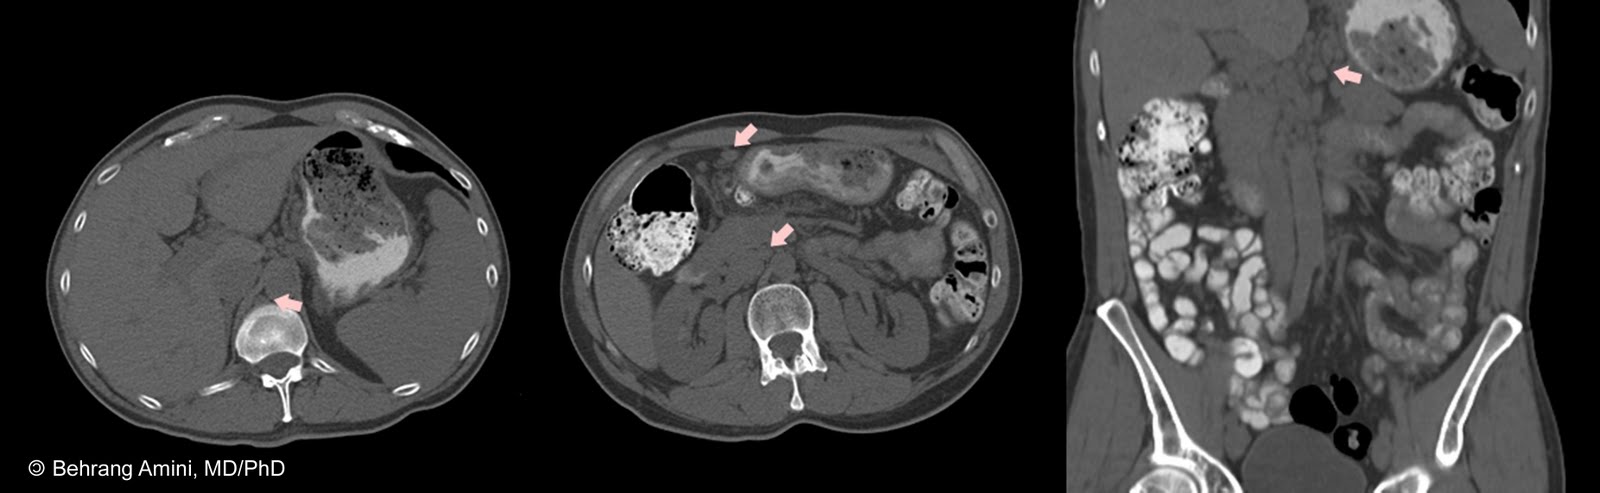
Imaging findings can include nephromegaly, renal stone formation with obstructive uropathy, and findings of posterior reversible encephalopathy syndrome (PRES).

References

  • Cairo MS, Bishop M. Tumour lysis syndrome: new therapeutic strategies and classification. Br J Haematol. 2004 Oct;127(1):3-11.
  • Kaito E, Terae S, Kobayashi R, Kudo K, Tha KK, Miyasaka K. The role of tumor lysis in reversible posterior leukoencephalopathy syndrome. Pediatr Radiol. 2005 Jul;35(7):722-7.
  • Lehner SG, Gould JE, Saad WE, Brown DB. Tumor lysis syndrome after radiofrequency ablation of hepatocellular carcinoma. AJR Am J Roentgenol. 2005 Nov;185(5):1307-9.
  • Parisi MT, Fahmy JL, Kaminsky CK, Malogolowkin MH. Complications of cancer therapy in children: a radiologist's guide. Radiographics. 1999 Mar-Apr;19(2):283-97.

Wednesday, June 29, 2011

Intraventricular Oligodendrogliomas

Intraventricular oligodendrogliomas are rare tumors that have imaging characteristics different from oligodendrogliomas arising in the brain parenchyma. Patients tend to present with headaches due to increased intracranial pressure and usually have a shorter duration of symptoms. This is in contrast to patients with parenchymal lesiosn, who tend to present with focal neurologic deficits or seizures.

It has been suggested that some cases of intraventricular oligodendrogliomas may actually represent central neurocytomas due to the similar imaging and histopathologic findings.

CT shows a high-attenuation lesions that enhance on contrast administration and attach to the ventricular wall. MRI reveals lesion heterogenous signal intensity on T1- and T2-weighted images with cystic and solid components and intense enhancement.

The images above show a mass in the trigone of the left lateral ventricle with heterogeneous attenuation on non-contrast CT. The mass has cystic and solid components on MRI, as well as areas of susceptibility roughly corresponding to the areas of higher attenutation on CT, likely representing calcification. The solid components enhanced on post-gadolinium images.

References

  • Atasoy Ç, Karagülle AT, Erden İ, Akyar S. primary oligodendroglioma of the lateral ventricle: computed tomography and magnetic resonance imaging findings. Journal of ankara medical school, 2002; 55(1): 39-44.
  • Koeller KK, Rushing EJ. From the archives of the AFIP: Oligodendroglioma and its variants: radiologic-pathologic correlation. Radiographics. 2005 Nov-Dec;25(6):1669-88.
  • McConachie NS, Worthington BS, Cornford EJ, Balsitis M, Kerslake RW, Jaspan T. Review article: computed tomography and magnetic resonance in the diagnosis of intraventricular cerebral masses. Br J Radiol. 1994 Mar;67(795):223-43.

Tuesday, June 28, 2011

Fibrothecoma of the Ovary

Fibrothecomas are benign sex cord–stromal tumors of the ovary composed of various proportions of fibromas and lipid-rich, estrogenic thecomas. Fibrothecomas can occur in pre- and post-menopausal women and are the most common of the sex cord–stromal tumors.

On US, fibrothecomas usually appear as a homogeneous hypoechoic mass with posterior acoustic shadowing, but in most cases the appearance of the tumor is nonspecific. CT reveals a homogeneous solid tumor with delayed enhancement. Dense calcifications are often seen.

Fibrothecomas have low signal intensity on T1- and T2-weighted images, representing the fribous component. Scattered high-signal-intensity areas in the mass represent edema or cystic degeneration. In masses with cystic degeneration, the solid component is usually located peripherally.

Differential considerations include uterine leiomyomata and other ovarian masses with fibrous components (fibroma, cystadenofibroma, and Brenner tumor). Differentiation from uterine leiomyomata can be made by noting that ovarian masses are usually supplied by ovarian arteries or by the ovarian branches of the uterine arteries that course along the fallopian tubes. The presence of interface vessels between the uterus and the adnexal mass can help differentiate a uterine leiomyoma from an ovarian fibromous tumor.

The images above show a hypoechoic right adnexal mass. A cystic component (not shown) was also visualized. It was initially felt that the mass was contiguous with the uterus and represented a pedunculated leiomyoma; however, because the right ovary could not be seen on ultrasound, an ovarian mass was also considered, and an MRI performed. MRI showed a right ovarian mass with heterogeneous signal intensity on T2-weighted images and low signal intensity on T1-weighted images (pink arrow). A peripheral cystic component (c) was also seen. No enhancement was seen following contrast administration.

References

  • Jung SE, Lee JM, Rha SE, Byun JY, Jung JI, Hahn ST. CT and MR imaging of ovarian tumors with emphasis on differential diagnosis. Radiographics. 2002 Nov-Dec;22(6):1305-25.
  • Outwater EK, Wagner BJ, Mannion C, McLarney JK, Kim B. Sex cord-stromal and steroid cell tumors of the ovary. Radiographics. 1998 Nov-Dec;18(6):1523-46. Review.

Monday, June 27, 2011

Sella Turcica Dimensions on Radiographs

lateral skull x-ray showing a mildly enlarged sella turcica. The length of the sella is determined by taking the greatest distance from the anterior wall of the sella to the most posterior portion of the posterior wall. The height is measured from the level of the tuberculum sellae to the most inferior portion of the floor of the sella.

The lower limits of normal for length and height of the sella on radiographs are 5 mm and 4 mm, respectively. The upper limits of normal for length and height of the sella on radiographs are 17 mm and 13 mm, respectively.

An abnormally small sella may indicate primary pituitary or growth hormone insufficiency, but is usually of no pathologic significance. An enlarged sella turcica may represent a normal variant or be due to a tumor (adenoma, prolactinoma, craniopharyngioma, meningioma), cystic lesion (Rathke cleft cyst, mucocele), aneurysm, pituitary hyperplasia (primary hypothyroidism), or empty sella syndrome.

In the case shown above, the length and height of the sella are 17 mm and 15 mm, respectively. As of this post, no follow-up study is available.

Special thanks to Dr. Jason Tsai for the case.

References

  • Robertson WD, Newton TH. Radiologic assessment of pituitary microadenomas. AJR Am J Roentgenol. 1978 Sep;131(3):489-92.
  • Taveras JM, Wood EH. Diagnostic neuroradiology: Williams & Wilkins Co, Baltimore (1964), pp. 1.96–1104.

Sunday, June 26, 2011

Cystic Vestibular Schwannoma

Vestibular schwannomas are the most common lesions of the cerebellopontine angle. Cystic vestibular schwannomas are less common and present with different clinical and imaging features. They tend to be larger and have a shorter clinical course prior to symptomatic presentation. Also, due to the possibility of rapid enlargement of the cystic elements, conservative management with follow-up is not recommended.

The rate of postoperative complications may also be different between cystic and solid vestibular schwannomas. The main postoperative complication is damage to the facial nerve near its entrance into the porus acusticus, especially when there are multiple cysts or when the cysts are on the anterior surface of the tumor.

On imaging, cystic vestibular schwannomas can have a single small cyst or multiple intramural cysts of variable size. The intramural cysts may have higher signal intensity than that of cerebrospinal fluid, but may also be isointense to cerebrospinal fluid on both T1- and T2-weighted images. Intramural cysts also demonstrate circumferential enhancement.

The images above reveal a predominantly cystic mass at the left cerebellopontine angle with extension into the porus acusticus (red arrow). There is thin circumferential enhancement with a thin septum with the cystic component. There is a solid component anteriorly that demonstrates homogeneous enhancement. The FLAIR image reveals mild edema within the adjacent cerebellum and middle cerebellar peduncle. No restricted diffusion was seen within the cystic component (not shown).

References

  • Benech F, Perez R, Fontanella MM, Morra B, Albera R, Ducati A. Cystic versus solid vestibular schwannomas: a series of 80 grade III-IV patients. Neurosurg Rev. 2005 Jul;28(3):209-13.
  • Tali ET, Yuh WT, Nguyen HD, Feng G, Koci TM, Jinkins JR, Robinson RA, Hasso AN. Cystic acoustic schwannomas: MR characteristics. AJNR Am J Neuroradiol. 1993 Sep-Oct;14(5):1241-7.

Saturday, June 25, 2011

Dermatomyositis in Children: MRI Findings

Childhood dermatomyositis is a multisystemic disease characterized by diffuse nonsuppurative inflammation of muscle fibers and skin. The disease affects blood vessels and is classified as a systemic vasculopathy.

Patients initially present with proximal lower extremity weakness, followed by proximal upper limb weakness and contractures. The skin lesions typically include discoloration of the upper lids and malar aspect of the face.

Radiographs and CT reveal sheet-like calcifications aligned along the planes of muscle and fascia in a symmetric distribution.

MR images reveal increased T2 signal in infarcted muscles affected by the vasculitis (yellow arrows) with edema in the fascial planes and subcutaneous fat. Children with dermatomyositis may also have extensive subcutaneous and intermuscular calcium-rich fluid collections (pink arrows), which can be differentiated from abscesses by the minimal peripheral enhancement seen in the former.

Muscle calcification, although rare, is more common in children, and occurs after a long evolution.

The main differential considerations are:
  • Polymyositis: Has a similar distribution and MRI appearance, but affects an older age group. Edema-like abnormalities are said to be more common and muscle atrophy less common in dermatomyositis compared with polymyositis.
  • Fasciitis:
  • Infectious myositis: Asymmetric distribution. May have abscesses with peripheral enhancement.
  • Muscle injury: Asymmetric muscular distribution
  • Subacute muscle denervation:
  • Radiation therapy: Asymmetric with with a well-delineated, sharp margin of abnormalities in the radiation field
  • Rhabdomyolysis:

References

  • Garcia J. MRI in inflammatory myopathies. Skeletal Radiol. 2000 Aug;29(8):425-38.
  • Hernandez RJ, Sullivan DB, Chenevert TL, Keim DR. MR imaging in children with dermatomyositis: musculoskeletal findings and correlation with clinical and laboratory findings. AJR Am J Roentgenol. 1993 Aug;161(2):359-66.
  • Chan WP, Liu GC. MR imaging of primary skeletal muscle diseases in children. AJR Am J Roentgenol. 2002 Oct;179(4):989-97.

Friday, June 24, 2011

Abdominal Sarcoidosis

Sarcoidosis typically presents with lung involvement; however, abdominal viscera are frequently involved as well.
  • Liver: Most common imaging abnormality is hepatomegaly (30%). May also have multiple low-attenuation intrahepatic septa on contrast-enhanced CT; multiple low-attenuation, low-intensity (on all sequences), and poorly enhancing nodules nodules.
  • Bile ducts: Involvement of intrahepatic bilde ducts can result in a cholestatic picture, mimicking that of primary biliary cirrhosis. Involvement of the extrahepatic ducts can produce strictures that mimic cholangiocarcinoma, while enlargement of portal lymph nodes can compress the biliary tree to produce obstructive jaundice.
  • Spleen: Splenomegaly is seen in about 30%. Low-attenuation/intensity (on all pulse sequences) splenic nodules are seen in 5% - 30% of patients. Isolated/predominant nodular splenic disease is more common than isolated/predominant hepatic nodular disease. Punctate calcifications may also be seen.
  • Lymph nodes: Our patient's only manifestation of sarcoidosis on the unenhanced CT was adbominal adenopathy. In fact, one study found that abdominal adenopathy was the only abnormal finding in approximately 50% of patients in one study.

    Abdominal adenopathy is seen in about 30% of patients. Nodal calcification is unusual in sarcoidosis. The main differential, lymphoma, has essentially the same distribution of adenopathy, although retrocrural lymph nodes are seen more frequently (70%) in patients with lymphoma compared to those with sarcoidosis (20%). Our patient had retrocrural, retroperitoneal, and mesenteric adenopathy, and lymphoma was considered as a possibility.
  • Pancreas: Direct pancreatic involvement is uncommon, but may result in diabetes or pancreatitis. Sarcoid-associated hypercalcemia may also result in acute pancreatitis.
  • Kidneys: While the kidney is involved in 5%-20% of cases at autopsy, a radiographically detectable renal mass is unusual. Nephromegaly or renal atrophy may be the only manifestation. The appearance of granulomas in renal sarcoid is similar to that previously described for the liver and the spleen. The main differential considerations are lymphoma and metastasis.

    The most common effect of renal sarcoidosis is hypercalciuria (more common) or hypercalcemia, which may result in nephrocalcinosis, nephrolithiasis, and interstitial calcium deposition. However, radiographically detectable nephrocalcinosis is uncommon, having been reported in 1%–4% of patients. The mechanism is increased conversion of 25-hydroxyvitamin D3 to active 1,25 dihydroxyvitamin D by macrophages in granulomas, resulting in increased intestinal calcium absorption.

    An interesting result of this disturbance in calcium metabolism is the effect of sunlight. Acute sunlight exposure can precipitate hypercalcemia in this setting, resulting in malaise, dehydration, or acute pancreatitis.
  • Gastrointestinal Tract: Radiographically visible involvement of the gastrointestinal tract appears to be uncommon, with appearances ranging from plaques and ulcers to linear and polypoid filling defects. The stomach is most commonly affected, where involvement can result in mucosal nodularity and thickened irregular folds that mimics Ménétrier disease, or a linitis plastica appearance that can mimic gastric adenocarcinoma.

References

Warshauer DM, Lee JK. Imaging manifestations of abdominal sarcoidosis. AJR Am J Roentgenol. 2004 Jan;182(1):15-28.